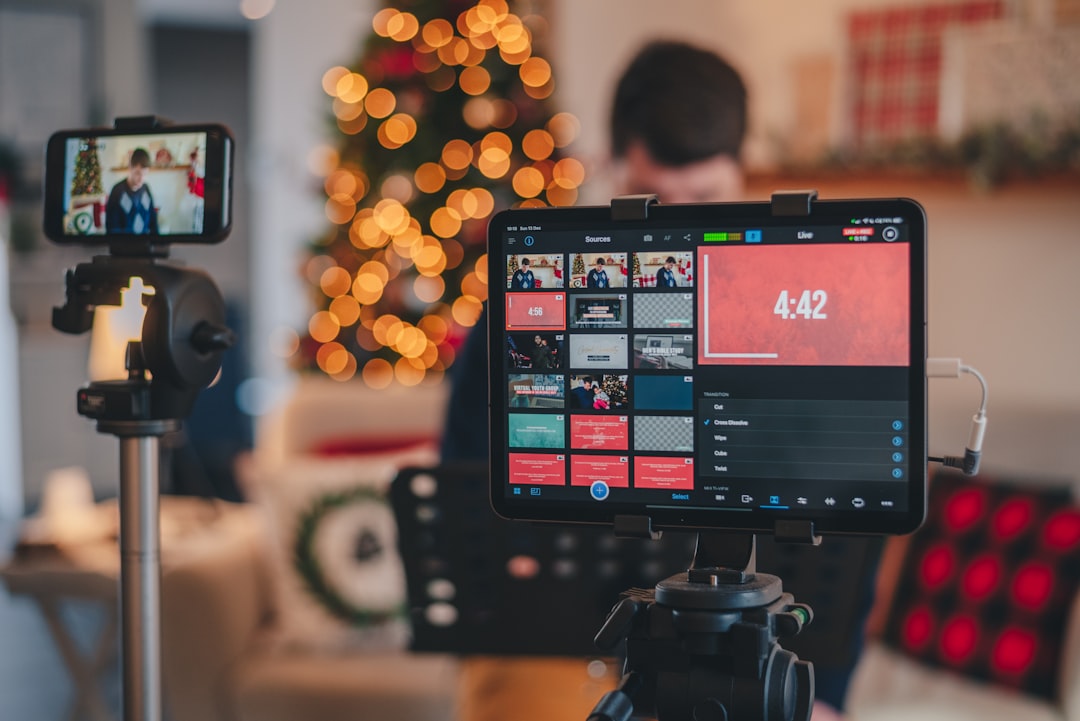
A post-stream review turns a dashboard full of numbers into practical decisions. This guide provides a repeatable way to evaluate reach, retention, engagement, replay value, and technical quality across Twitch, YouTube Live, and similar platforms—without treating any single metric as the whole story.
Overview
The most useful live stream analytics review is not a search for one “good” number. It is a comparison between the purpose of the broadcast and the evidence left behind. A product demonstration may prioritize watch time and clicks, while a community stream may care more about returning viewers, chat participation, and follows. A training session may need to balance retention with replay performance and technical reliability.
Begin every review by recording the stream’s context:
- Stream title, date, platform, category, and duration
- Primary objective, such as education, community building, promotion, or conversion
- Topic, format, hosts, guests, and major segments
- Promotion used before the event and any schedule changes
- Known incidents, including audio problems, dropped frames, outages, or moderation issues
Platform dashboards may label or group metrics differently, and reporting windows can vary. Record the metric name exactly as shown in the relevant dashboard, along with the date you collected it. This makes recurring reports easier to compare when interfaces or definitions change.
What to track
Use the following categories as a core post-stream review. You do not need every available metric for every broadcast; consistency is more valuable than collecting a long list that no one uses.
| Category | Metrics to record | Question to ask |
|---|---|---|
| Reach | Unique viewers, total views, impressions where available, and peak concurrent viewers | Did the stream reach the intended audience, and when did attention peak? |
| Viewing depth | Total watch time, average watch time, average concurrent viewers, and retention points | Did people stay for the substance of the stream or leave during the opening? |
| Engagement | Chat messages, active chatters, reactions, shares, follows, subscriptions, or other platform actions | Did viewers participate, and which segments prompted a response? |
| Traffic and outcomes | Link clicks, registrations, downloads, sales-page visits, or other tracked actions | Did the broadcast support its business or community objective? |
| Replay performance | Replay views, watch time, retention, comments, and delayed conversions | Does the recording remain useful after the live event ends? |
| Technical quality | Dropped frames, stream interruptions, encoder warnings, bitrate changes, audio incidents, and video incidents | Could production problems explain changes in viewing behavior? |
| Operations | Moderation actions, unanswered questions, timing overruns, and support incidents | What should the team change in preparation or staffing? |
Track peak concurrency separately from total viewers. A large audience accumulated over several hours is not the same as a concentrated audience watching at one point. Likewise, total watch time can rise simply because a stream was longer. Use duration and average viewing measures to add context.
Retention is especially useful when divided into moments rather than treated as one summary percentage. Mark the opening, topic changes, guest introductions, demonstrations, calls to action, technical interruptions, and closing. A sharp decline immediately after a segment can suggest a mismatch between the promise and the content, while a rise may indicate that promotion or a scheduled guest brought viewers in late.
Technical quality belongs in the same report as audience metrics. If viewers leave during a microphone failure, frozen camera, or encoder overload, the audience data alone cannot explain the result. For production-specific follow-up, use the live stream quality troubleshooting decision tree and the guide to OBS encoder overload and dropped frames.
Cadence and checkpoints
A practical review has three checkpoints. First, complete a quick operational review soon after the broadcast while the team still remembers what happened. Record incidents, notable audience questions, segment timings, and any data that may be available only for a limited reporting period.
Second, complete the main analytics review after the platform has finished processing the live and replay data. Compare the stream with the previous broadcast of the same format where possible. Avoid comparing a short community session with a long webinar unless the difference is part of the question being studied.
Third, review trends monthly or quarterly. A single stream can be affected by topic, timing, promotion, guests, seasonality, platform discovery, or an unusual technical incident. A recurring review helps separate a repeatable pattern from a one-off result.
Use a simple record for each broadcast:
- Context: date, duration, platform, format, objective, and audience.
- Reach: viewers, peak concurrency, and traffic source information available to you.
- Retention: average viewing, watch time, and timestamps where viewers leave or return.
- Engagement: chat activity, follows, shares, questions, and calls to action.
- Outcome: clicks, registrations, sign-ups, or another clearly defined result.
- Quality: dropped frames, audio or video incidents, interruptions, and recovery time.
- Decision: one thing to keep, one thing to change, and one test for the next stream.
Limit the final action list. If every metric produces a different project, the review becomes difficult to apply. Assign an owner and a due date to changes involving production, promotion, moderation, or follow-up.
How to interpret changes
Interpret metrics as relationships, not isolated scores. For example, lower reach with stronger retention may indicate that the topic appealed to a narrower but more relevant audience. Higher reach with weak retention may point to broad promotion, an unclear opening, or a title that set expectations the stream did not meet.
Use these diagnostic comparisons:
- Reach up, retention down: Review the opening promise, first five to ten minutes, traffic sources, and any early technical problems.
- Reach down, retention steady: Review promotion, timing, topic demand, discoverability, and whether the event was announced consistently.
- Chat up, clicks down: Check whether the call to action was clear, well timed, and relevant to the discussion.
- Watch time up, average viewing flat: Consider whether a longer broadcast added value or merely increased total minutes through duration.
- Replay performance strong: Identify evergreen sections, improve the title and description, and add useful chapters or follow-up resources where supported.
- Technical incidents rise alongside exits: Review the recording and event log before changing the content strategy.
Compare like with like, and annotate differences in format. A guest interview, product launch, Q&A, and tutorial naturally produce different viewing patterns. If the event used several platforms, keep platform-specific figures separate before creating a combined view. A combined total can be useful for reporting, but it may hide where the audience actually engaged.
Do not infer causation from timing alone. A retention decline after a topic change may be related to the topic, a lengthy transition, a notification wave, or a simultaneous audio issue. Pair dashboard data with the stream timeline, chat transcript, moderation notes, and production log.
When to revisit
Revisit this review after every recurring broadcast, then conduct a broader comparison monthly or quarterly. Update the tracking sheet when a platform changes metric names, dashboard locations, export formats, or the reporting window you rely on. Record the change rather than silently replacing historical labels; otherwise, future comparisons may appear more consistent than they really are.
Return to the template before launching a new format, changing the stream schedule, adding a guest, or introducing a new call to action. Define success in advance so the team does not select a favorable metric after the results are known. For a production change, review the streaming setup compatibility guide. For a recurring live event, pair analytics with the live webinar checklist and the backup and failover plan.
End each review with a short decision note: keep, change, and test. Keep the practice that supported the objective, change the clearest weakness, and test one measurable improvement in the next broadcast. Over time, this creates a useful operating record for content, promotion, moderation, and technical support—without turning analytics into a report that is read once and forgotten.